
Part 1: Data visualization is too fun. My team made an app that consumes a user’s trip data and uses it to draw cool stuff. Here’s how we used React, D3 and Google Maps to do it.
This is part 1 of a 3-part series about using Google Maps and D3 to create an elevation graph that responds dynamically with user interaction. Here are all 3 posts:
To DOM, or Not to (Virtual) DOM
One of the first decisions we have to make when using D3 and React together is who gets control of the DOM. In this video Shirley Wu does a great job explaining when each library should get control.
Check out the project’s source code on GitHub, or watch the 15-second demo below!
Shirley goes on to explain that it’s usually best to let React paint the DOM since it manages state and, presumably, the inputs to our chart will live on state.
However in our case, because we have 100 elevation samples from Google Maps API to manage (each sample a nested object containing keys such as elevation and location, which is itself an object with latitude and longitude keys), it didn't make sense from a performance standpoint to give React control of the DOM.
Even if we were to use a PureComponent to avoid doing deep comparisons and minimize re-renders, we’re still managing references to 100 objects, and 100 shallow comparisons is still 100 comparisons.
So we made the decision to store things like map markers on state only when absolutely necessary, and to never store our samples on state. For this reason, we decided to let D3 control how the ElevationChart paints the DOM.
What We’ll Be Building
Here’s the feature we’ll be building:
We have 2 topics to cover: making Google Maps in React and data-visualizations with D3.
First we’ll cover 1) configuring and theming your map, 2) adding markers and drawing polylines, 3) dynamically adjusting the map’s “frame”, 4) using InfoWindows to show a marker’s elevation, and 5) getting a list of elevations along a pathline.
Second we’ll build an ElevationChart using the list of elevation samples along the pathline. We’ll add interactive features and user hover events to dynamically render a DOM node on the map we created in the first section.
I won’t cover how to get a Google Maps API key, and I assume you have a working knowledge of React lifecycle methods. We’ll be coding everything in JavaScript, but it would not be difficult to port this project to a different language if you prefer.
A detailed API specs is available in the Google Maps Documentation.
Making Maps with React
This is what we need to do:
- Get data: We’ll use Google’s Distance and Elevation APIs to create an array with 100 objects representing samples along our polyline
- Draw the maps: Use the Google Maps API to draw a map and its parts according to the data it receives as input
- Draw the data: Add the D3 library and draw an SVG chart to represent this data visually
- Draw the infobox: When a user hovers over the chart, we show the user the Elevation and Grade at that point
- Draw the blip: Based on where the user hovers, we need to draw a blip (almost a marker, but not quite) on the map at that point along the path
Are you excited? I am too. Let’s get started.
1. Get Data
Let’s look at the docs for the Google Maps Elevation API to see what we’ll be working with.
From the Google Map Docs:
...you may request sampled elevation data along paths, allowing you to calculate elevation changes along routes.
This is exactly what we need to do!
Note: See the docs on the LatLng class and the Marker API for more info on the Google Maps objects we’ll be working with.
By the end of this post you’ll be defining a custom React map component with a method called getElevationAlongPath that does exactly this.
Let’s skim this code so you have an idea where we’re headed, then we’ll fool around with some maps.
1import React from "react"23// Calculates beeline distance between 2 points along geodesic surface:4const calcDistance = (5 { lat: fromLat, lng: fronLng },6 { lat: toLat, lng: toLng }7) => {8 // Assumes google is available on the window object9 // (we’ll talk about how to handle this later):10 return window.google.maps.geometry.spherical.computeDistanceBetween(11 new window.google.maps.LatLng(fromLat, fromLng),12 new window.google.maps.LatLng(toLat, toLng)13 )14}1516export default class ChartWrapper extends React.Component {17 state = {18 distances: [],19 elevations: [],20 markers: []21 }2223 // componentDidMount() { ... }24 // componentDidUpdate(prevProps, prevState) { ... }2526 // Returns a bunch of elevation samples along the path we provide it:27 getElevationsAlongPath = () => {28 // Check if we have enough markers to make a path (2+):29 if (this.state.markers.length > 1) {30 const elevator = new window.google.maps.ElevationService()31 const latLngs = this.state.markers.map(marker => ({32 lat: marker.getPosition().lat(),33 lng: marker.getPosition().lng()34 }))3536 // We can also use the Distance API to calculate distance btwn Markers:37 const { distances } = latLngs.reduce(38 (acc, curr, i, arr) => {39 if (i === arr.length - 1) return acc40 const distances = acc.distances.concat(41 // Use the helper function we defined above:42 calcDistance(43 { lat: curr.lat, lng: curr.lng },44 { lat: arr[i + 1].lat, lng: arr[i + 1].lng }45 )46 )47 return distances48 },49 { distances: [] }50 )5152 // API request to get our elevation samples:53 elevator.getElevationAlongPath(54 {55 path: latLngs,56 samples: 10057 },58 results => {59 this.setState({60 distances,61 // We’ll probably want to massage the data shape later:62 elevations: results.map(result => result)63 })64 }65 )66 }67 }6869 render() {70 /* ... */71 }72}
Let’s talk through it.
First, calcDistance is a helper function that takes 2 objects of shape {lat: number, lng: number} and returns the distance between them in meters.
However, if we have 5 markers, there will be 4 distance calculations between them. Having 2 arrays of unequal lengths complicates things, so we initialize the first distance to 0 (lines 36-42).
Now we have 5 markers and 5 distances and we don’t have to do maths later.
Second, in lines 49-61 we call the Elevations API, passing in the path we want to take samples from along with the number of samples we want. We ask for 100 samples because again, math is hard.
When we call our method (in our case, inside componentDidUpdate), our ChartWrapper state will look something like this:
1{2 distances: [3080.666166039471, 2841.623465928883, /* ... */ ],3 markers: [<GoogleMapsMarkerObject>, <GoogleMapsMarkerObject>, /* ... */ ]4 elevations: [5 {6 elevation: 149.1212768554688,7 location: <GoogleMapsLatLngClass>,8 resolution: 9.543951988220215,910 },11 {12 elevation: 152.5092315673828,13 location: <GoogleMapsLatLngClass>,14 resolution: 9.543951988220215,15 },16 // 98 more elevations...17 ]18}
Success! ✨ Let’s start drawing.
2. Drawing the Maps
First we’ll render a simple map, because we need to make sure our API key is working and because it’s fun.
Basic Map with Layer
Let’s start with Madrid. We can use the TransitLayer API to sketch out the arteries of the Metro de Madrid public transit system while we’re at it.
Loading...
Sí, tú estás luciendo bien allí, Madrid.
The Madrid Metro is a rapid transit system serving the city of Madrid, capital of Spain. The system is the 12th longest rapid transit system in the world, with a total length of 293 km, though Madrid is approximately the fiftieth most populous metropolitan area in the world.
– Wikipedia
Bounded Map with Markers & Polyline
Next we need to draw some markers and connect them by a path (or “polyline”, in Google-Maps-speak). We can’t use the Directions API without a Premium account, and last I checked it takes $10,000 to open one of those. So our polyline will be an approximation of a user’s trajectory rather than a shortest path algorithm.
Our team needed to support rendering this data dynamically based on user input. Dropping, dragging and deleting markers – and then updating map state – is not the focus of this article, plus besides I’m sure you already know how you would go about it. If you’re curious what we did, the Maps folder of our repo contains all that logic.
Point being: We’re going to keep hardcoding values for now, but we’ll switch it up to keep things lively. Let’s go to San Francisco now because I can’t afford to go in real life:
Loading...
Great! We now have 18 markers representing a stroll down Lombard Street.
Notice how clicking “Show Markers” adjusts the map’s zoom and bounds to neatly frame the markers, while hiding them returns our map to its initial state.
Here’s the method that builds up a LatLngBounds object for us and then adjusts our map’s “lens” to contain it:
1class MyMapComponent extends React.Component {2 setMapBounds = (map, positions) => {3 let bounds = new window.google.maps.LatLngBounds()4 positions.forEach(p => {5 const bound = p.position6 ? { lat: p.position.lat(), lng: p.position.lng() }7 : { lat: p.lat, lng: p.lng }8 bounds.extend(bound)9 })10 map.fitBounds(bounds)11 }1213 render() {14 /* ... */15 }16}
Lines 5-7: If you’ve worked with the GM API for any length of time, you’ve probably gotten tired of keeping track of whether you’re dealing with an instance of the LatLng class — where latitude, for example, is accessible by calling the function LatLng.position.lat().
We got tired of converting back and forth, so we wrote setMapBounds to accept either type. For every coordinate object or LatLng instance we pass in, we adjust the outer bounds of our map, and finally we fit the map to those boundaries.
Drawing the polyline is as simple as:
1class MyMapComponent extends React.Component {2 polyline = null3 drawPath = (map, markers) => () => {4 const path = markers.map(marker => ({5 lat: marker.getPosition().lat(),6 lng: marker.getPosition().lng()7 }))8 const polyline = new window.google.maps.Polyline({9 path,10 strokeColor: "#000c3c",11 strokeOpacity: 1,12 strokeWeight: 2.513 })14 this.polyline = polyline15 polyline.setMap(map)16 this.setState({ showPath: true })17 }1819 render() {20 /* ... */21 }22}
Notice that we did not make this method as flexible as setMapBounds w/r/t its arguments; we learned the hard way that drawing and especially redrawing polylines is more complex than adjusting the map’s zoom and position. If this seems counterintuitive (it did to me at first), think of changing a map like adjusting a lens, instead of destroying and rebuilding a DOM element: nothing in the environment has actually changed, just your window into the state of the world has shifted.
The map is not the territory.
Alfred Korzybski
Line 14: We add the polyline to our class for use throughout the rest of the component. We also need to keep track of it so we can remove it later when the user clicks “Hide Path” (“Hide Markers” too, otherwise we’d have a marker-less path floating around with nothing anchoring it down!).
Now let’s get those elevation samples.
Map Showing Elevation at Locations
Loading...
Looks like we’re in Hawaii now. What are we doing here?
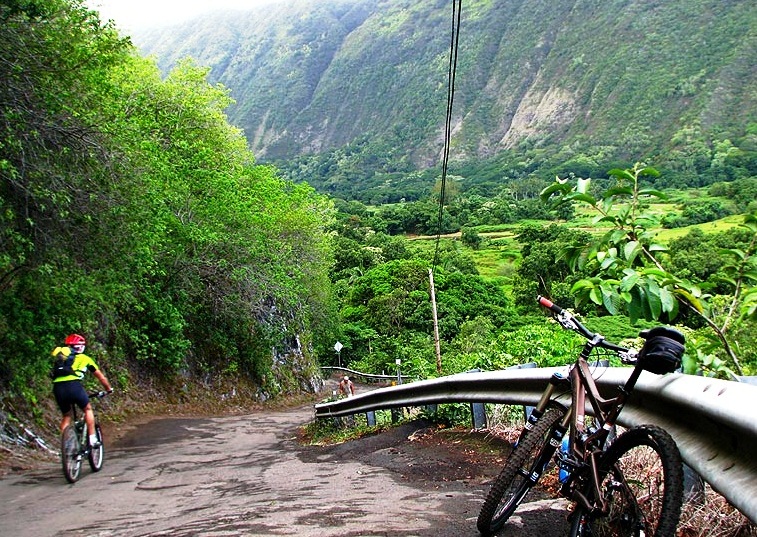
[Waipio Valley Road] gains 800 vertical feet (243.84 m) in 0.6 miles (0.9 km) at a 25% average grade, with steeper grades in sections. This is a paved public road but it is open only to 4 wheel drive vehicles. It is the steepest road of its length in the United States.
– Wikipedia
If you click through the markers you’ll see how quickly the elevation changes. We’ll probably want to start thinking about how to calculate the distance between points, too, so our users have more concrete data to work with when using our app.
Let’s take this a step further. What if we could show users the elevation delta along the path they’ve drawn?
Fetching Elevation Samples Along a Path
Instead of getting the difference in elevation between each point, we can ask for n number of elevation samples along a path. Requesting 100 samples along a polyline, for example, is a relatively cheap request (1 API call) for how much data we get, and our area chart will be that much more granular.
Loading...
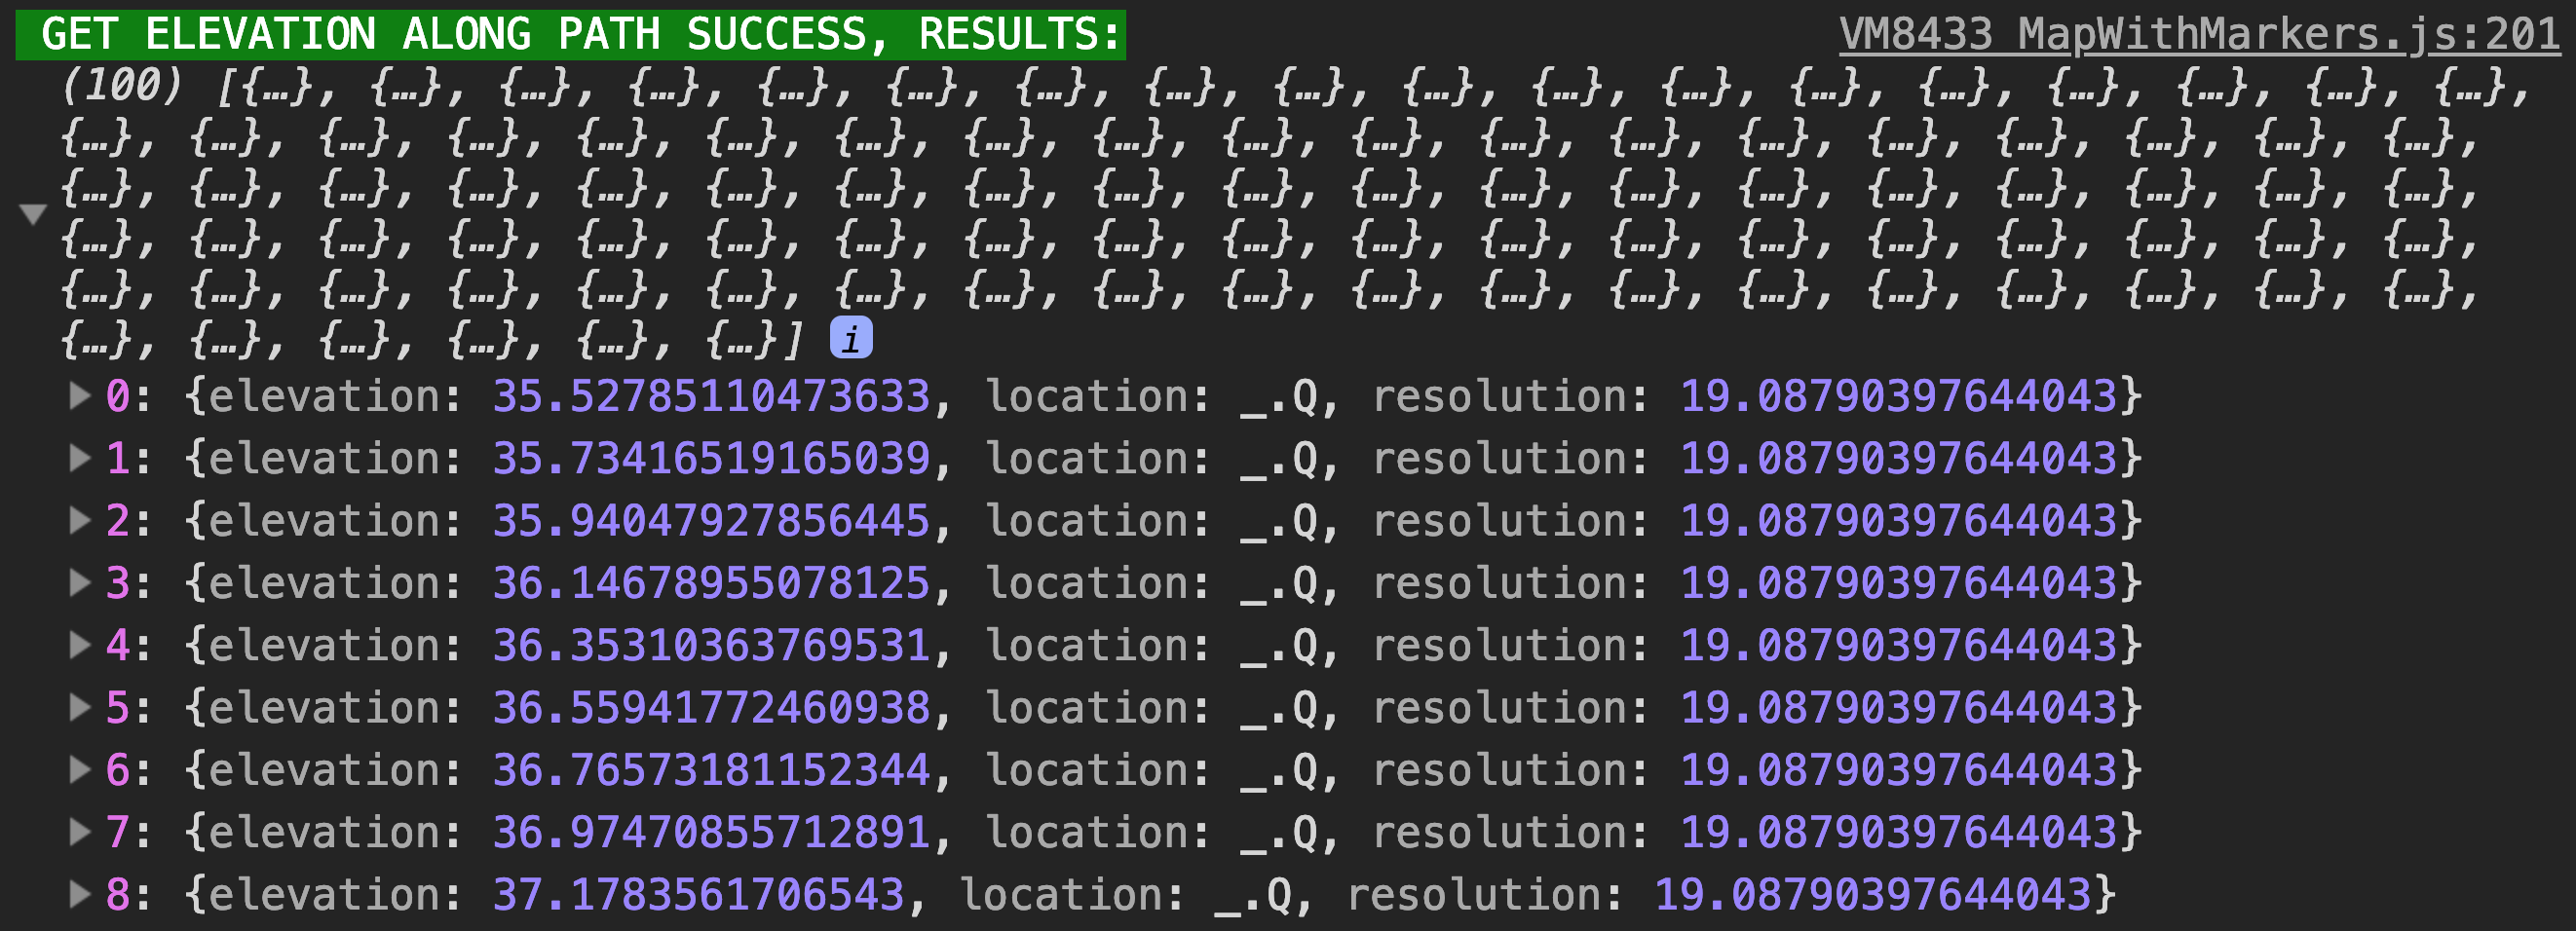
Click “Elevation Samples” and check your browser console to see the raw data the GM API is returning! It’ll be green, like this:
Here’s how I wrote the query that I’m using in this blogpost (alternatively, see how we did it in production):
1class MyComponent extends React.Component {2 getElevationAlongPath = (map, polyline) => () => {3 const { maps } = window.google4 const elevator = new maps.ElevationService()5 elevator.getElevationAlongPath(6 { path: polyline.getPath().j, samples: 100 },7 (results, status) => {8 if (status === "OK") {9 // Keep this log around so a reader has access via her console:10 console.info(11 "%c GET ELEVATION ALONG PATH SUCCESS, RESULTS:",12 "background: green; color: white;",13 results14 )15 // Strip off `resolution` field; we don't need it:16 const elevationSamples = results.map(({ elevation, location }) => ({17 elevation,18 location19 }))20 this.setState({ elevationSamples })21 }22 }23 )24 }2526 render() {27 /* ... */28 }29}
To keep this example simple, we store the elevation samples at this.state.elevationSamples, an array containing 100 objects with this shape:
1{2 elevation: Number,3 location: {4 lat: () => Number,5 lng: () => Number,6 }7 resolution: Number8}
If you highlight the MapWithMarkers component using React DevTools, you can access the component in your console by asking for $r, a new global React DevTools has made available to you.
$r is an essential tool for debugging React applications. Here we use it to look at our data exactly as it exists on state. Here it is in action:
Here’s what I did to access the elevation and created a latLng object from the object at the first index:
1> es = $r.state.elevationSamples2// => (100) [{...}, {...}, {...}, {...}, ...]3> es.elevation4// => 35.527851104736335> { lat: es[0].location.lat(), lng: es[0].location.lng() }6// => { lat: -45.84831, lng: 170.53305999999998 }
Great. Put those elevations somewhere you won’t lose them – local component state is probably okay if you’re not expecting the values to change much.
Great! On to the next one.
3. Drawing the data
For browser performance (and my own sanity), I broke the D3 portion out into a separate post.
Read all the juicy D3 deets here!
... In that Empire, the Art of Cartography attained such Perfection that the map of a single Province occupied the entirety of a City, and the map of the Empire, the entirety of a Province. In time, those Unconscionable Maps no longer satisfied, and the Cartographers Guilds struck a Map of the Empire whose size was that of the Empire, and which coincided point for point with it. The following Generations, who were not so fond of the Study of Cartography as their Forebears had been, saw that that vast map was Useless, and not without some Pitilessness was it, that they delivered it up to the Inclemencies of Sun and Winters. In the Deserts of the West, still today, there are Tattered Ruins of that Map, inhabited by Animals and Beggars; in all the Land there is no other Relic of the Disciplines of Geography.
Note: This is part 1 of a 3-part series about using Google Maps and D3 to create an elevation graph that responds dynamically with user interaction. Here are all 3 posts: